
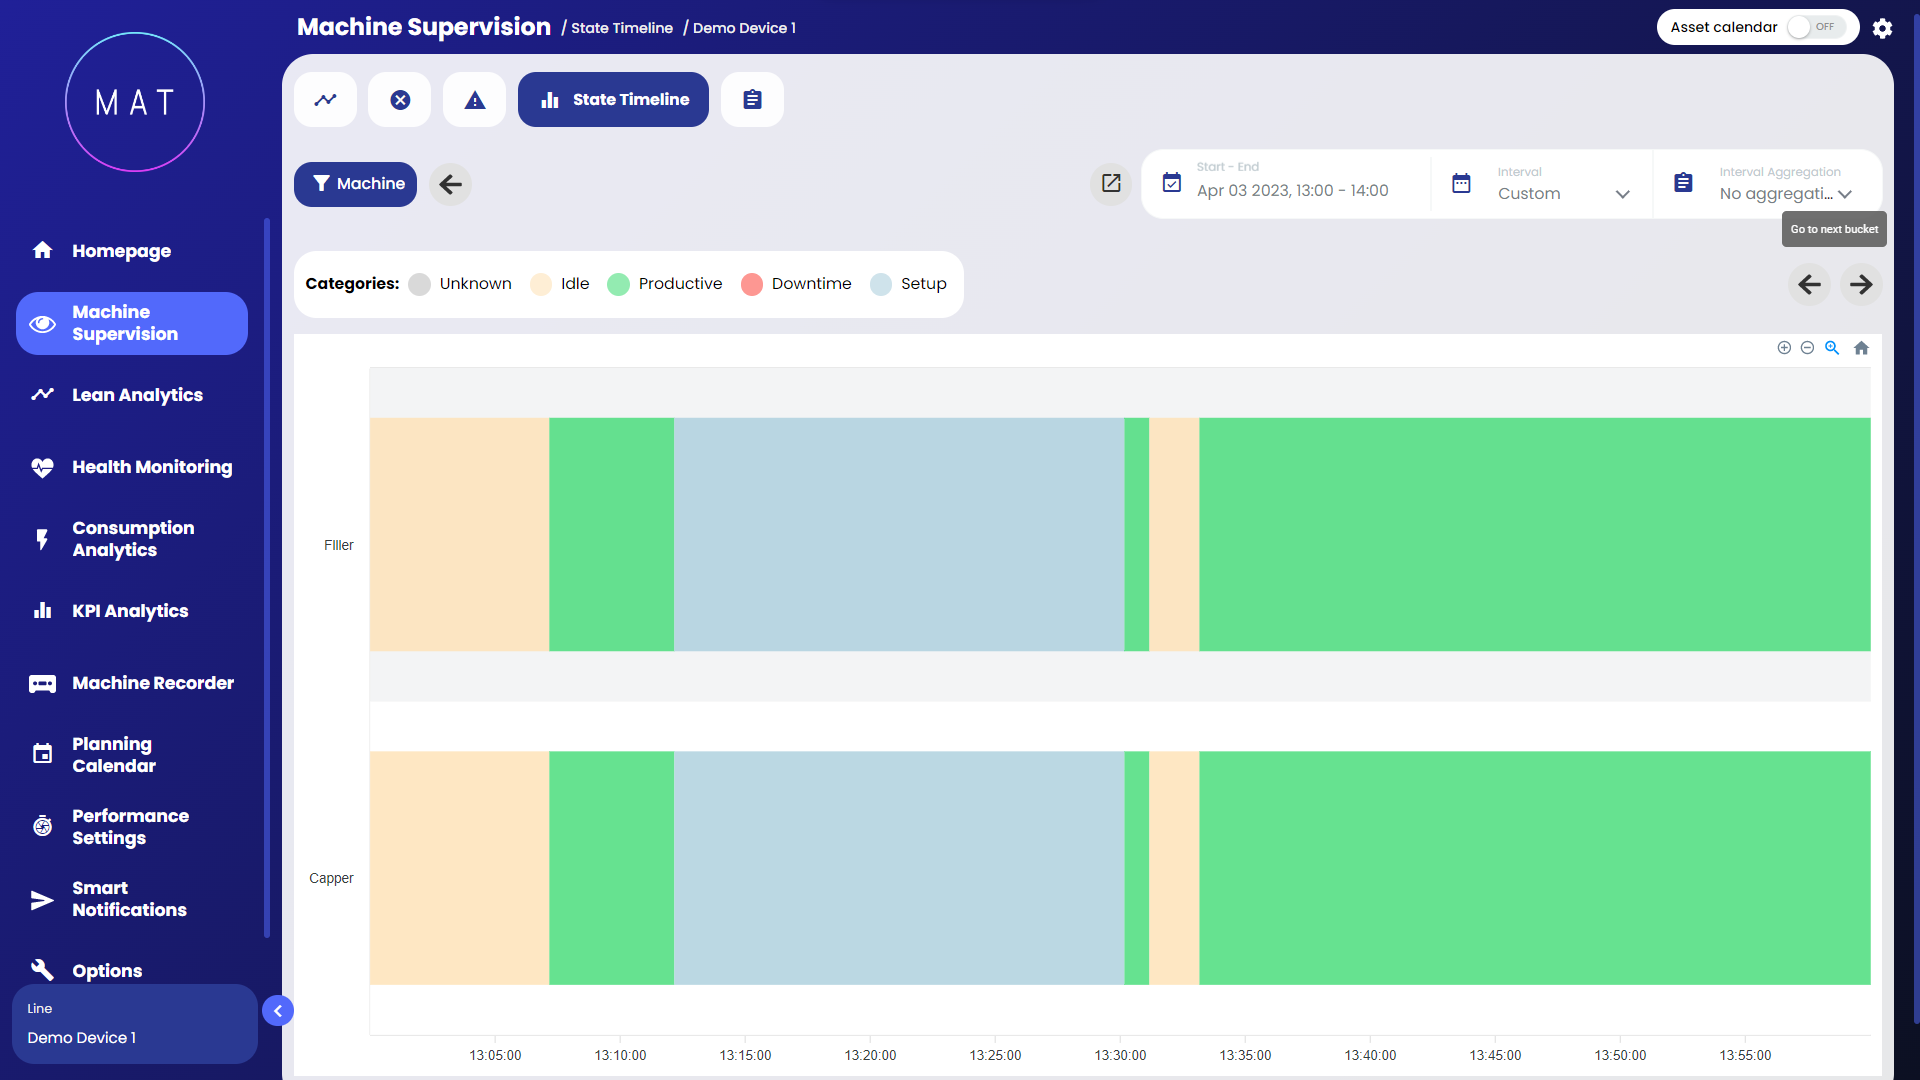
States Timeline
This subsection displays the total time spent in each machine state over the selected time frame using bar and Gantt graphs.
These visual representations allow for easy identification of production periods characterized by notable inefficiencies.

Each machine state is made distinguishable by a specific signal color:
![]()
Unknown
![]()
Pending
![]()
Productive
![]()
Stop
![]()
Preparation
![]()
Suspension
The "navigate to machine downtime detail" button directs directly to the "Downtime" subsection of the "Lean Analytics" form.
Clicking on "time aggregation" selects the criteria for displaying machine states in the GANTT (cumulative by hours, days or weeks).
By hovering the cursor over the various bars of the graph, the hours, minutes and seconds spent in each machine state appear in detail.
On the right of the chart of the aggregate times, the respective cumulative times are specified.


By selecting a single "bar" in the graph, drill-down navigation can be performed, exploring in detail the behavior of the machine/line on the day or shift corresponding to the selected bar.
It is possible to go as far as maximum detail, in which to analyze the succession of states compared to the occurrence of any alarms/messages.


Enabling the expanded view through a specific selector allows you to see the details of all the states that have occurred within the interval.