Operator Knowledge
The module dedicated to Operator Knowledge allows for the display of an analysis based on the interaction between the operator and the machine.

On the page, three graphs appear, each conveying different information. The granularity of the graph can be set by selecting the correct Temporal Aggregation, while the time period to be covered in the analysis can be defined thanks to the drop-down menu that indicates the Interval to be used. The ability to apply filters to the data is also maintained for this module.


The individual graphs can be configured for each application; in standard mode, they can be described as follows:
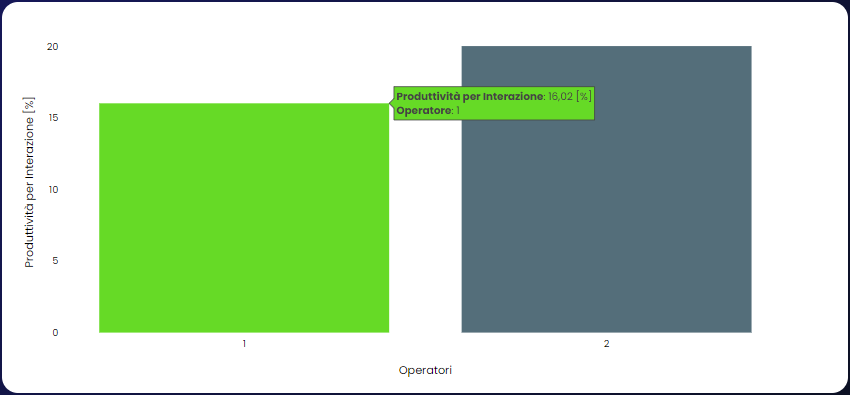
graph A: each bar represents the productivity level per interaction of an operator within the time unit;
graph B: each point is associated with an operator and expresses the relationship between normalized production time over total time and the number of interactions of the operator;
graph C: each bar represents the productivity associated with a single interaction for a given operator.