
Detailed Machine Analysis
The section summarizes in a single page some useful information related to the selected machine. All the information refers to the time interval, either predefined or customized, chosen by the user through a dedicated dropdown menu in the top right corner.
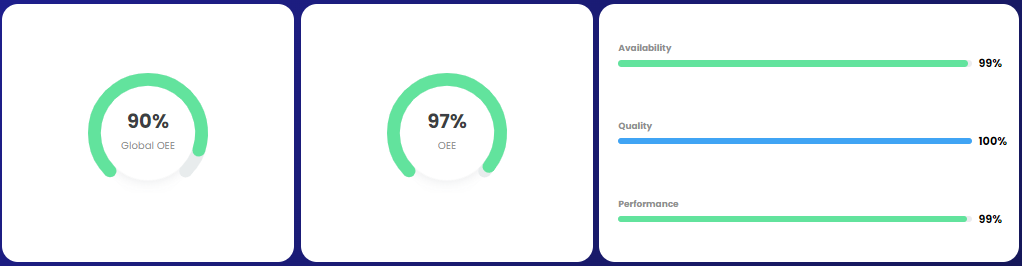
Dividing the screen into four quadrants, you can observe the following information:
in the top left, there are Key Performance Indicators (KPIs) related to Performance, Availability, Quality (if applicable for the current project), OEE, and Global OEE;
in the top right, there is a timeline representing the sequence of states recorded for the selected machine;

in the bottom left, there is a Pareto chart representing the machine downtimes in the selected time interval;

in the bottom right, there are some KPIs providing general information about the machine, all referring to the selected time interval.
