
Cycle Dashboard
The Cycle Dashboard section displays a screen containing useful information for analyzing a cycle and its phases. Unlike the Process Cycle Timeline section, this analysis focuses on the cycle as a whole rather than the exact sequence in which the phases occurred. The emphasis is on the types of phases rather than their individual occurrences. This dashboard is configurable, allowing users to customize the data visualization according to their specific needs for machine cycle analysis.
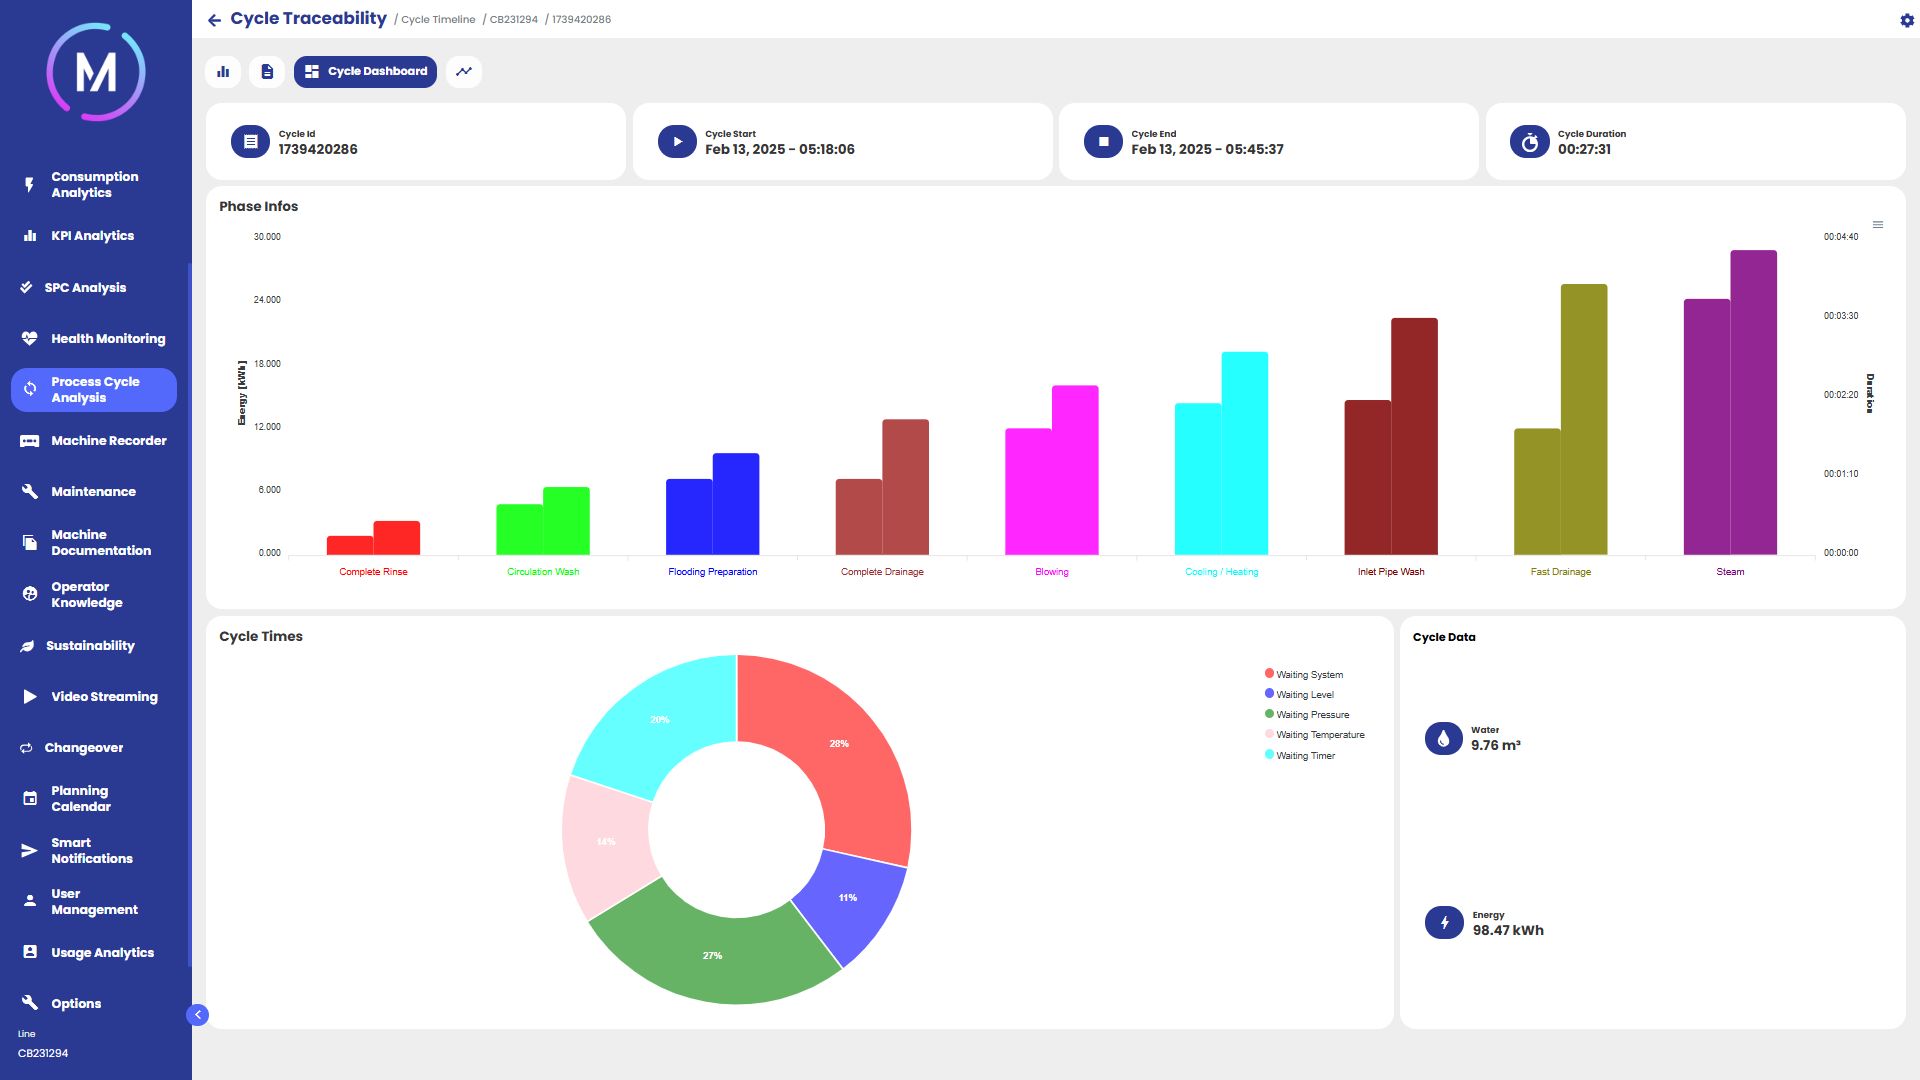
In the example shown in Image A, the objective is to analyze the duration of different phase types in relation to the products used while also providing an overview of how waiting times were distributed across various phases.
At the top of the page, a bar chart presents key information for each phase type. Each group of bars, represented by the same color, corresponds to a specific type of phase that occurred during the cycle.