
Production Traceability
This subsection is dedicated to the detailed tracking and analysis of production over time.

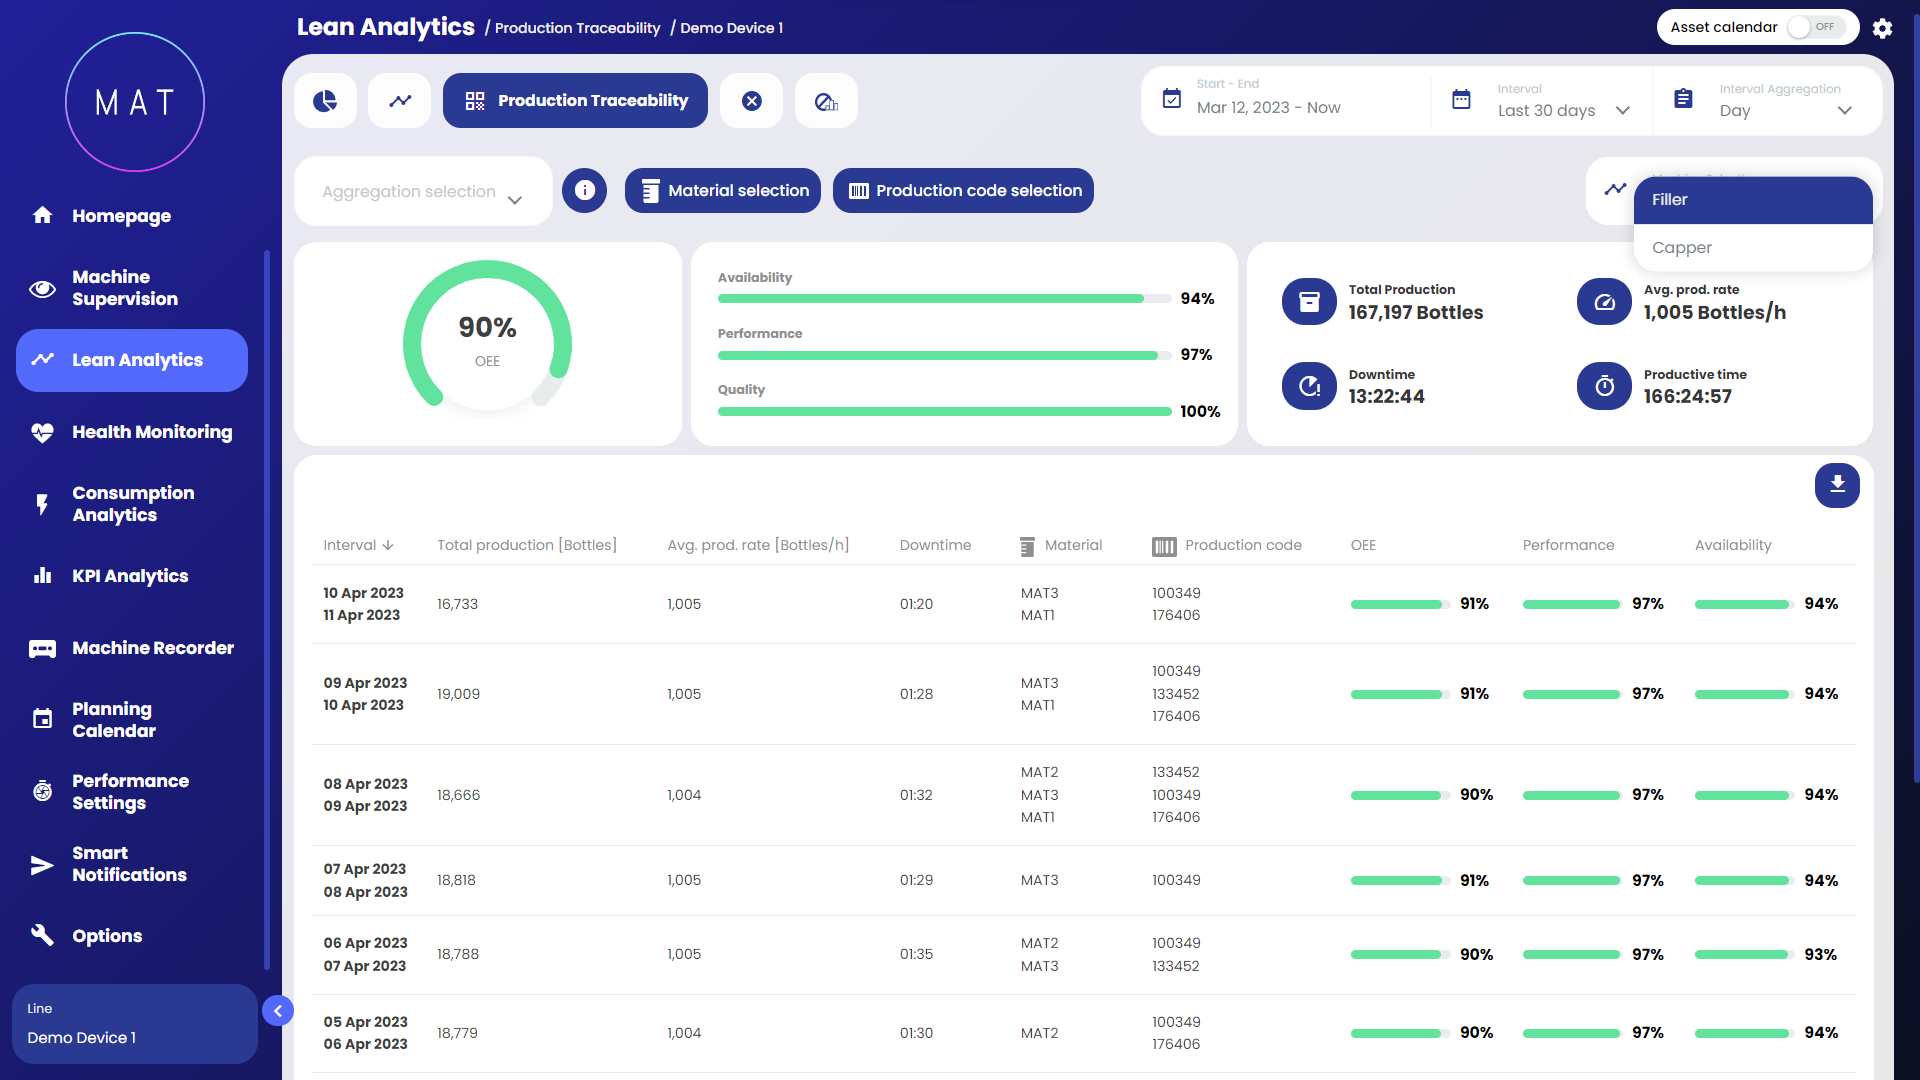
The cards in the upper portion of the dashboard display key production information with reference to the selected time period. This information is then specified and expanded upon for each record, i.e., for each "portion" of production that is to be investigated, in the scrolling table below the summary cards.
The various controls within the page allow you to do the following:
by selecting a particular time aggregation factor, it is possible to analyze production by "breaking it down" into hours/days/weeks or months;
by selecting a certain aggregation factor, it is possible to further subdivide production according to the selected factor, i.e.: shifts, batches, material used, etc. For example, if you select "week" as time period and "material" as aggregation factor, there will be as many rows for each week as the types of materials that were used during that week;
selecting a specific "record," i.e., clicking on a row in the table, leads to further detail subsection, which presents production information specifically related to the selected record, correlated with meaningful charts.


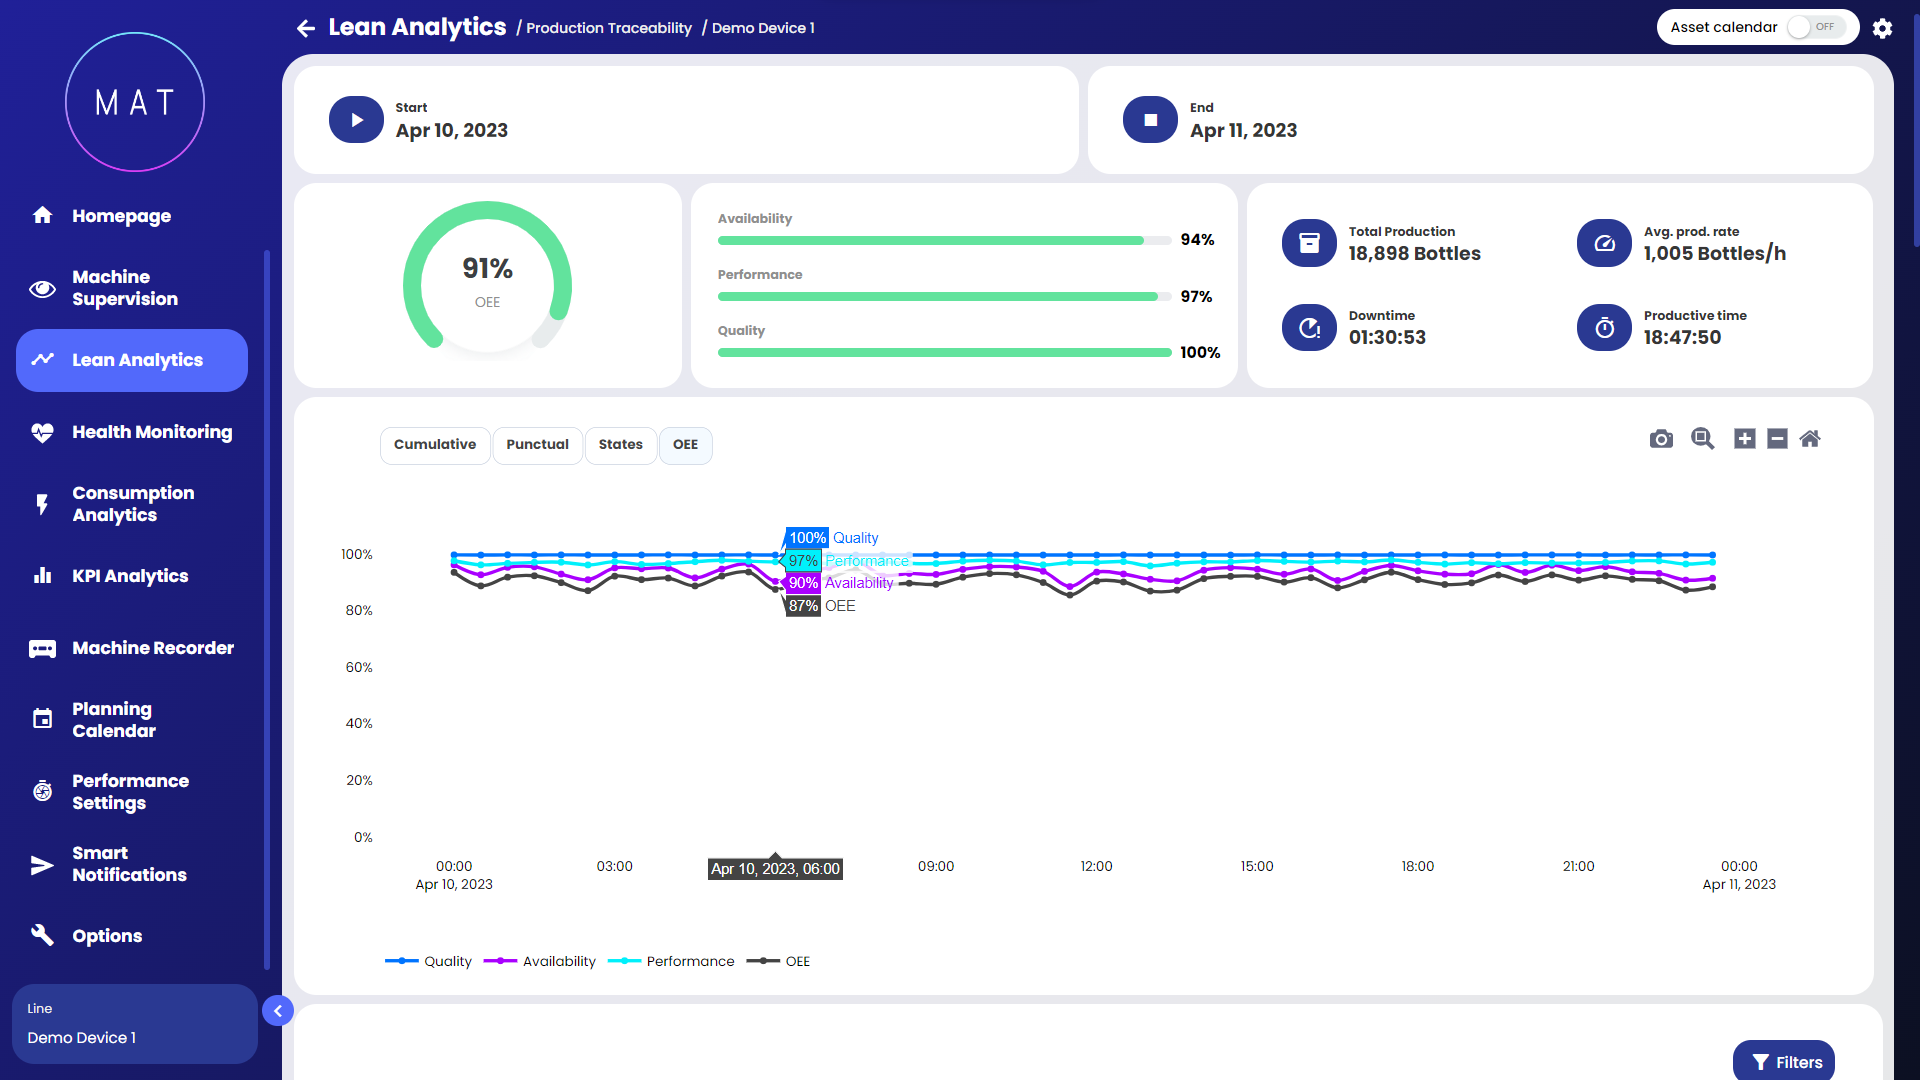
Within the detail page, the system returns an in-depth analysis of the production of the relevant record: OEE, Total Production, Downtime, etc.

Analyzing the page from top to bottom provides the following information:
start- and end-date and time of the selected portion of production;
general information on the efficiency of the selected production portion;
cumulative and point graph of parts produced, GANTT of the machine states subsumed during the production portion, and trend of OEE (see images G, H, I, L);
configurable Pareto chart where you can visualize downtime, alarms, or signalations data;
detailed list of event types that occurred during the selected production segment in the form of a log.


The types of events listed in the log (Image M) are generally three:
change of state: type of event that signifies a transition from one machine state to another. The "description" column specifies the machine states involved in the transition, indicating the "departure" state and the corresponding "arrival" state. The "machine state" column denotes the current state after the transition. As the state transition represents an instantaneous event, the "duration" column remains unpopulated since there is no measurable duration associated with the transition;
alarm triggered: type of event that signals the triggering of an alarm. The "description" column indicates the cause of the alarm. The "machine state" column indicates the machine state at the time of the event. Since the activation of an alarm is an instant in time, the "duration" column is not populated;
alarm deactivated: for each activated alarm, its deactivation event is recorded in the dashboard. The "duration" column displays the elapsed time between the activation and deactivation of the alarm, providing insights into the duration of the alarm occurrence. The "machine status" column indicates the state of the machine at the time when the alarm event took place;
Image Acquisition: only for those who have activated the feature, all image acquisitions that have occurred during the selected period are displayed in the list.
The event list can be filtered by event type, as shown in Image N.

