
Grid View

In this view (Image A.1), a card is displayed for each machine. In addition to the image and some general information about the plant and the owner, various KPIs are presented to describe the machine's production. The current state of the plant is also indicated in each card. There is the possibility of adding a chart to each card (Image A.2).

If the hierarchy.json file has been generated, usually through MCC, a control will be displayed allowing switching between classic and hierarchical viewing modes (Image B).

Selecting a card will open a new view showing all the elements within that card, and so on until reaching the level where only machines belonging to the explored hierarchy branch are present.


EXAMPLE
An example of hierarchy is shown in images Image C.1, Image C.2, Image C.3, Image C.4.
In Image C.1, the view upon opening the web app is displayed. It was decided to divide the machines by type of product manufactured, in this case we have three types: tomato sauce, fruit jam, and vegetable sauce.
Selecting the first card opens the second view, as shown in Image C.2. Here we have the distinction between tomato sauce production plants based on their geographical location.
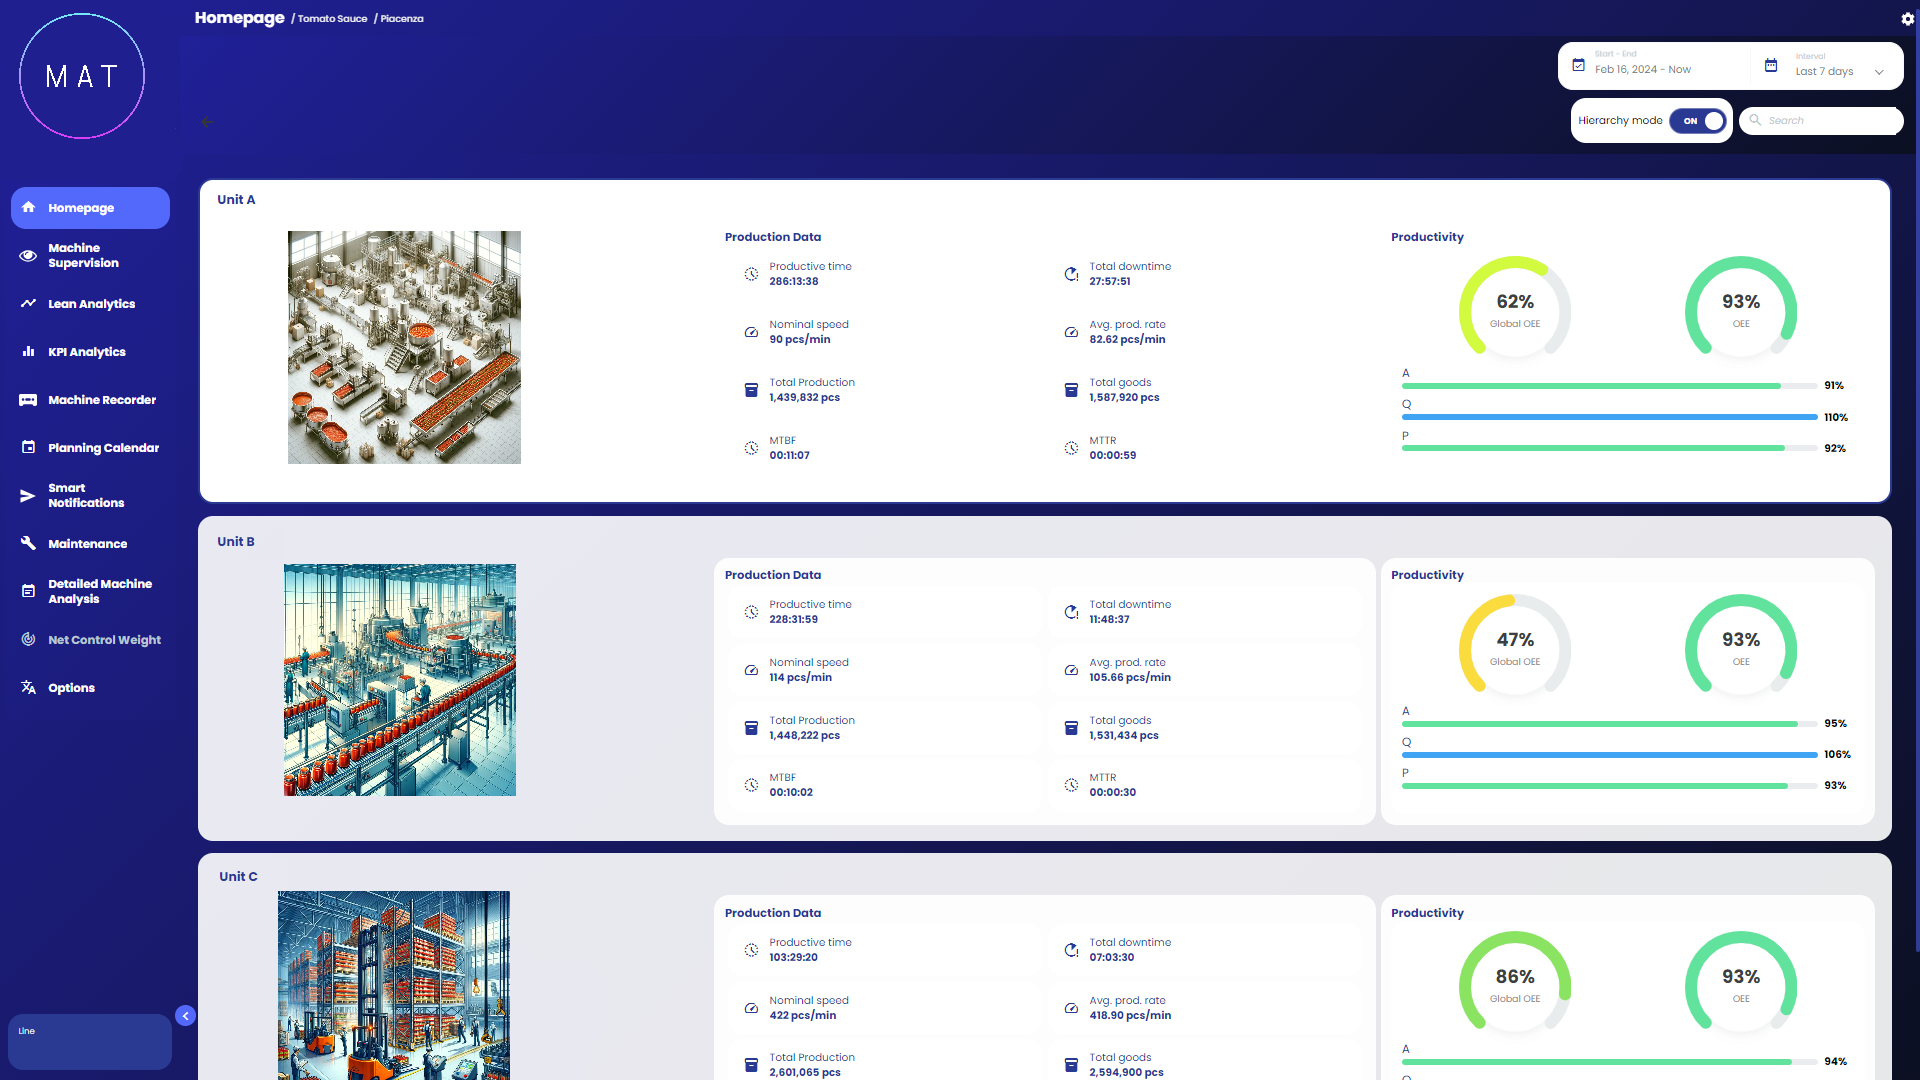
Suppose we choose the card related to the plant in Piacenza, the view will open as in Image C.3. For the plant located in Piacenza, I can choose to navigate within the various production units.
Selecting Unit A will display all the cards related to the machines belonging to that department, as in Image C.4.
For projects that have more than ten machines, a bar will be displayed in the page header containing some controls that allow users to select how many assets to display in the current view and to navigate between the various assets (Image D).
