
Breakdowns
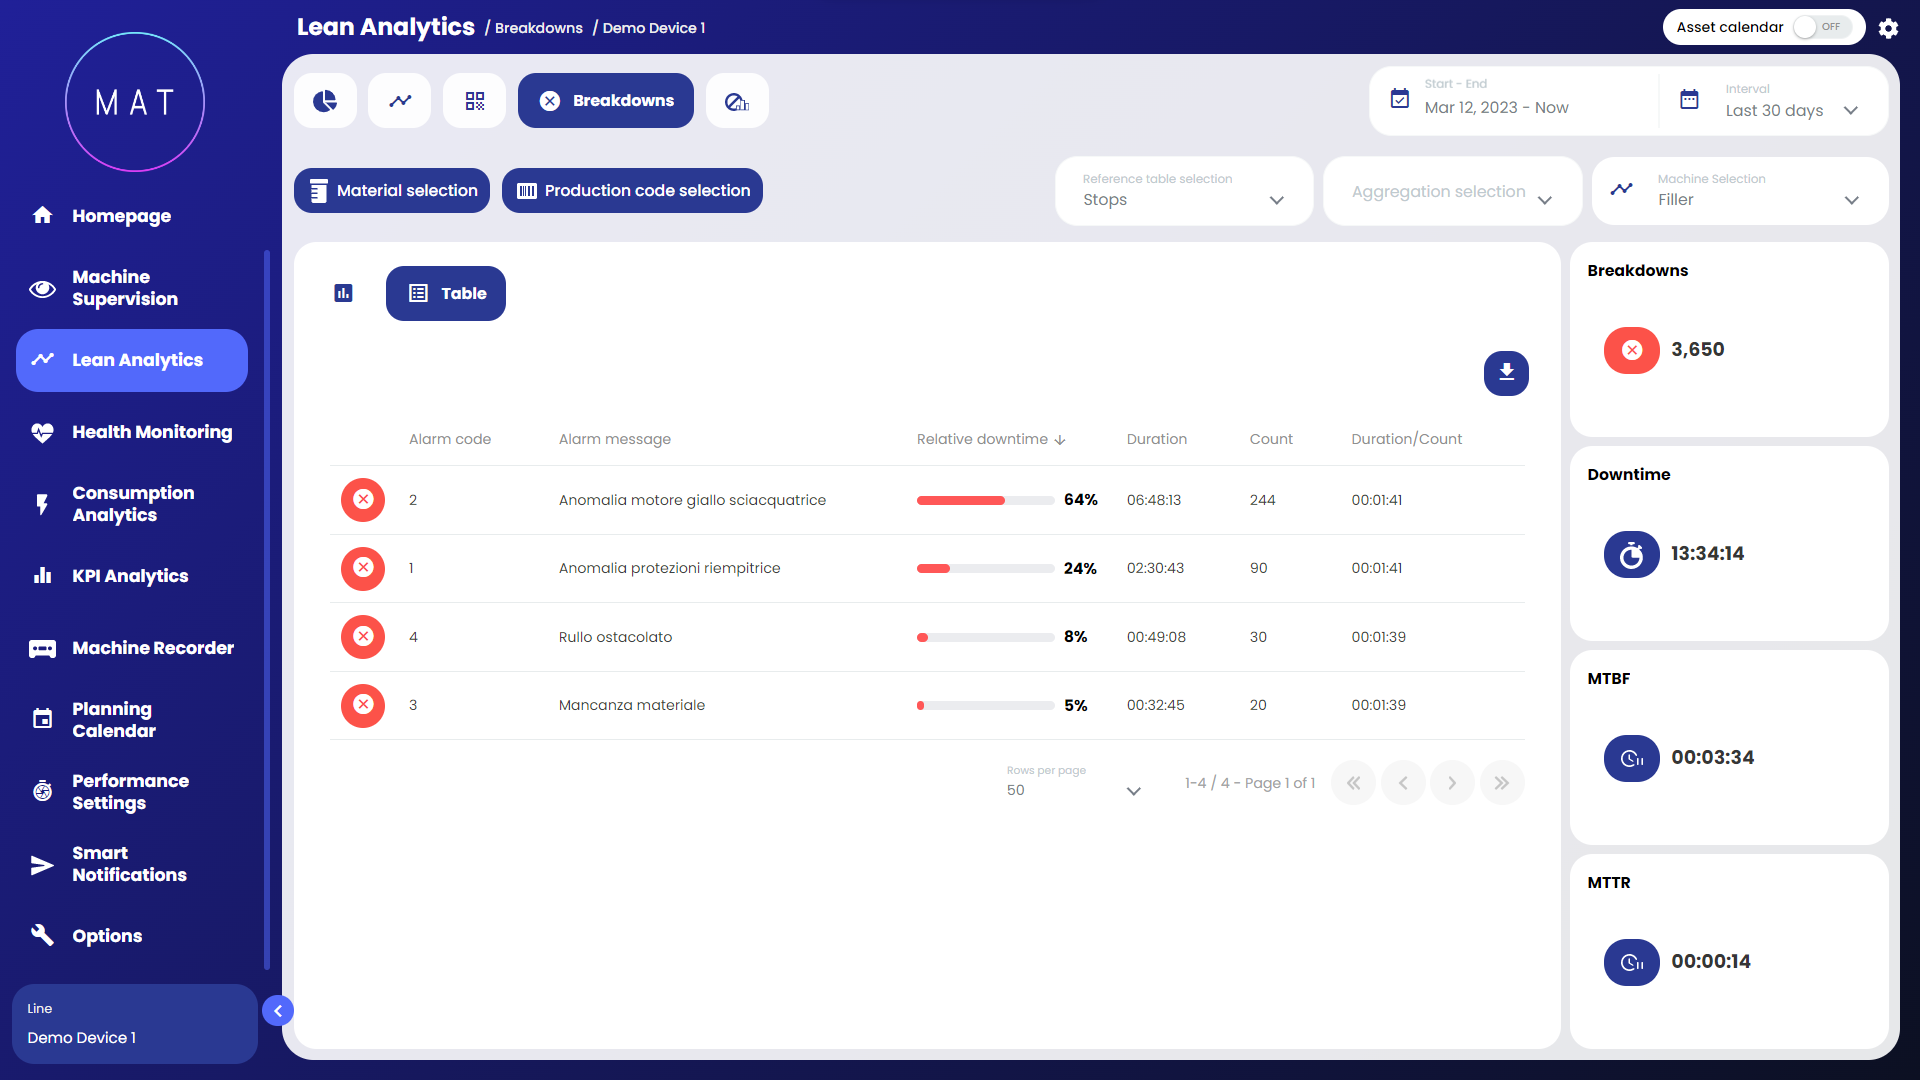
This subsection provides, in the form of a bar graph and in tabular format, an immediate report of the most impactful causes of downtime occurring on a machine/line.
The side widgets show the main information that connotes the reliability of a machine such as MTBF and MTTR indicators.

It is possible to visualize the incidence of individual alarms in the form of Pareto charts in terms of both duration and numerosity; this dual visualization makes it possible to distinguish alarms that are few in number but of long duration from those that are very numerous but of short duration.
The black line contextual to the graph represents the cumulative percentage of the relative impact of the various causes of downtime on the total; this allows immediate identification of the most impactful cause of alarm on total productivity (at the highest point reaching the black line).
Comparing the duration-to-count ratio values for each type of alarm provides immediate information about the relative weight of different alarms on productivity.
In both the Pareto chart and the tabular format, downtime causes are sorted according to the relative impact (in percent and in minutes) they have on total downtime: this will provide immediate feedback on the most impactful (vital few) downtime causes compared to the multitude of minority ones.


If the option is enabled, the Pareto chart displays, for each type of downtime cause, the proportion of lost OEE attributed to that cause. The value, represented as a percentage, is shown above the corresponding bar on the chart. This chart is referred to as the Advanced Pareto Chart.
