
Process Log
The Process Log section allows for the analysis of the trend of certain variables within a cycle.
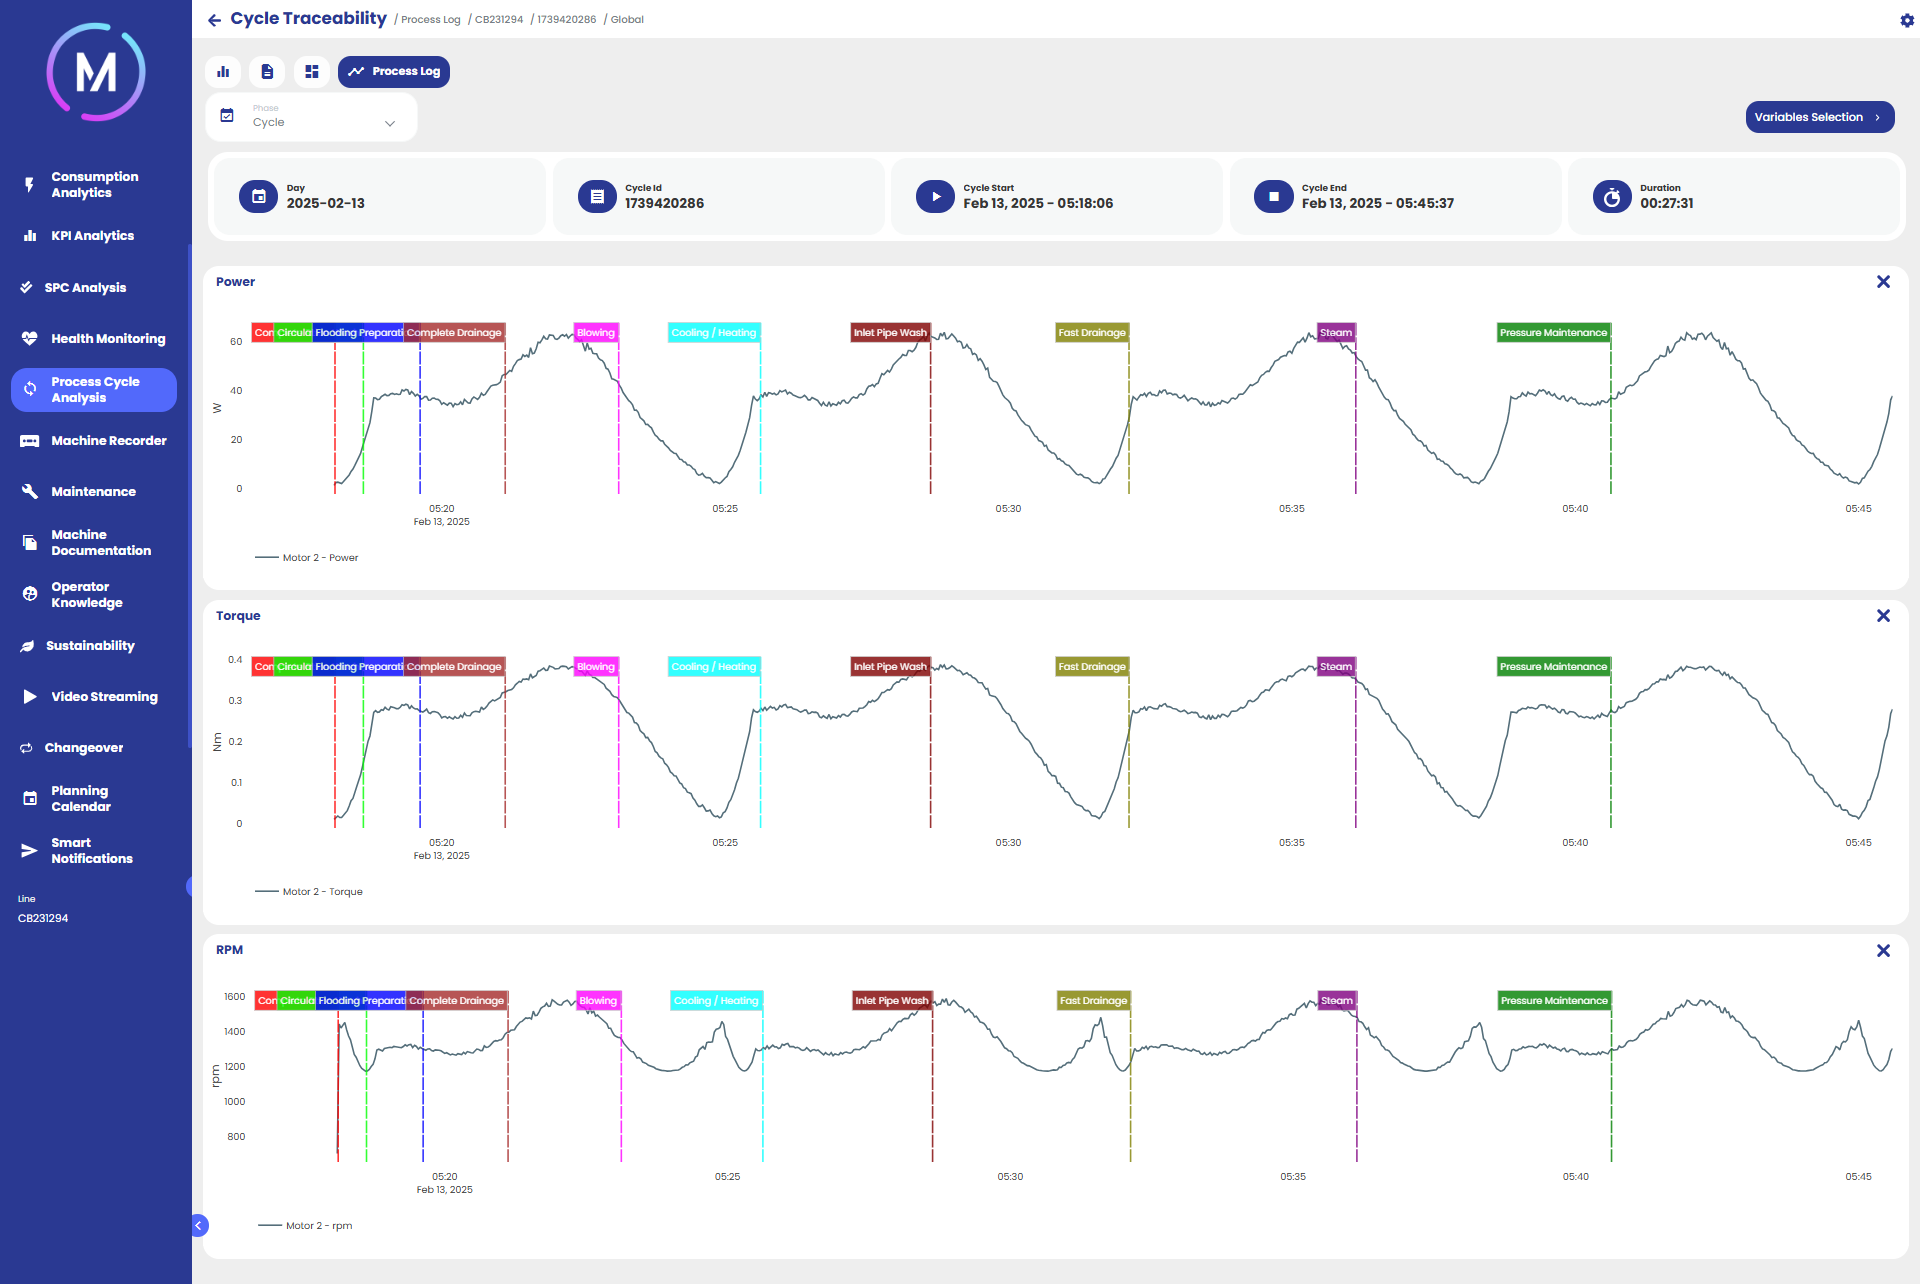
The page consists of several charts, each representing the trend of a single variable. The selector in the top left corner allows you to choose whether to analyze the entire cycle or a single phase.
If a phase is selected, the trend of the variable within that phase will be displayed. If the cycle is selected, the overall trend within the cycle will be shown, with the start of each phase indicated on the charts, allowing you to visualize the sequence of phases in relation to the variable's trend (Image A).
The selectable variables are the same as those present in the Machine Recorder section.