
Model Prediction
On this page, you can view the results of Object Detection.
To perform the analysis, a set of images must be provided as input, which are usually captured by cameras mounted inside, above, or near the plant or the section of interest.
Once an image is received, the software analyzes it to identify the objects that have been previously set as subjects for detection. The result is then presented to the user, who may decide to modify, correct, or add tags.

As can be seen from the image, the page is divided into two sections.
In the upper part, all the tags that the model can use to recognize objects are displayed. In addition to the name, some information about the occurrences of that object in the image set is displayed:
Number of occurrences: how many times that tag was detected in all the image sets;
Training occurrences: how many times the tag was used in the image set used for training the model, i.e., how many times the object associated with the tag was indicated;
Evaluated occurrences: how many times the tag was used in the input images, i.e., how many times the object to which the tag refers was recognized;
Number of images: the number of images analyzed by the model.
In the lower part of the page, the list of images that have been evaluated is displayed with some information, such as the date of evaluation, the model used, and the tags that have been associated with the image. The status is also shown: an image can be Evaluated if it has been received as input and analyzed by the model, or it can be a Training Set if the user has decided to modify the associated tags and has saved their work. In addition to the list view, it is possible to display a Pareto chart that shows the distribution of tags used in various images.

By selecting an image, you can open its detail.
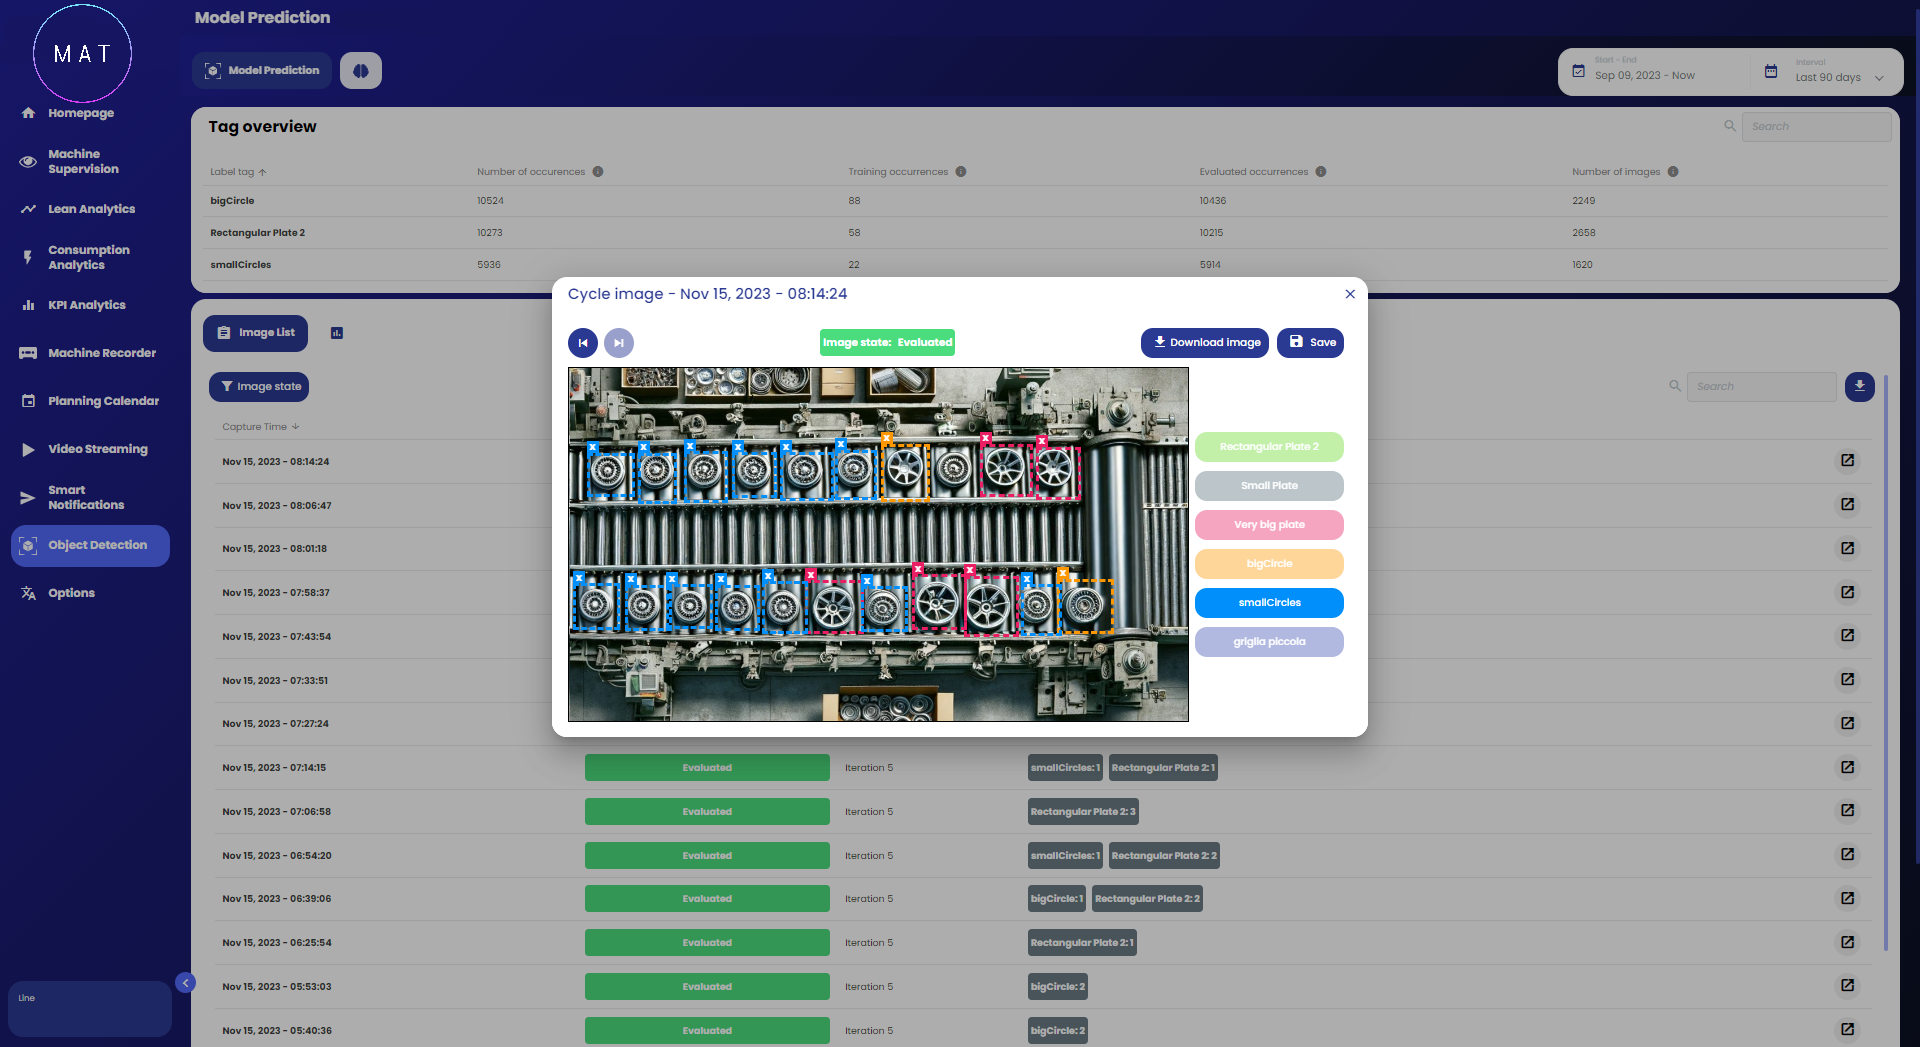
The window that opens shows the original image with the annotations made by the model. In addition to recognizing objects, their position can also be appreciated thanks to the colored boxes that highlight them. The color of the box indicates the associated tag according to the legend to the right of the window.
A very interesting feature is the possibility of correcting the model's work. In fact, when in this view, it is also possible to delete the displayed boxes, modify their size to better contain the object of interest, and draw new boxes on objects not highlighted. If you save the work done, the image with its new annotations will be automatically included in the set of images to be used for the next training. In this way, the model can be further refined.
In addition to viewing the identified objects and possibly correcting the analysis, it is also possible to download the image and the metadata associated with the various tags.
EXAMPLE
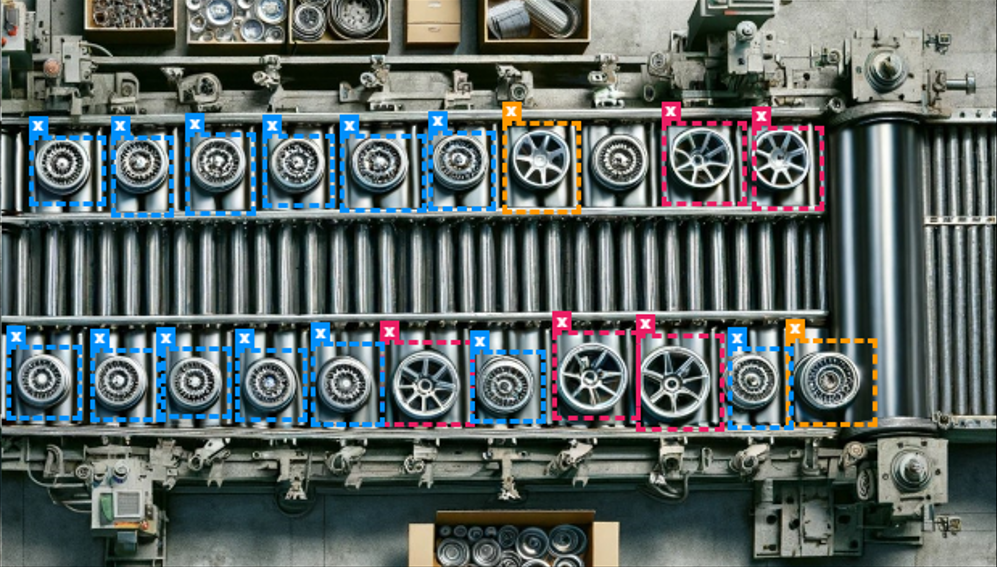
Image A shows a production line in which some objects have been recognized. In the example shown, the blue boxes identify "smallCircle" type objects, the orange ones are "bigCircle" type, and the fuchsia ones are "very big plate" type.
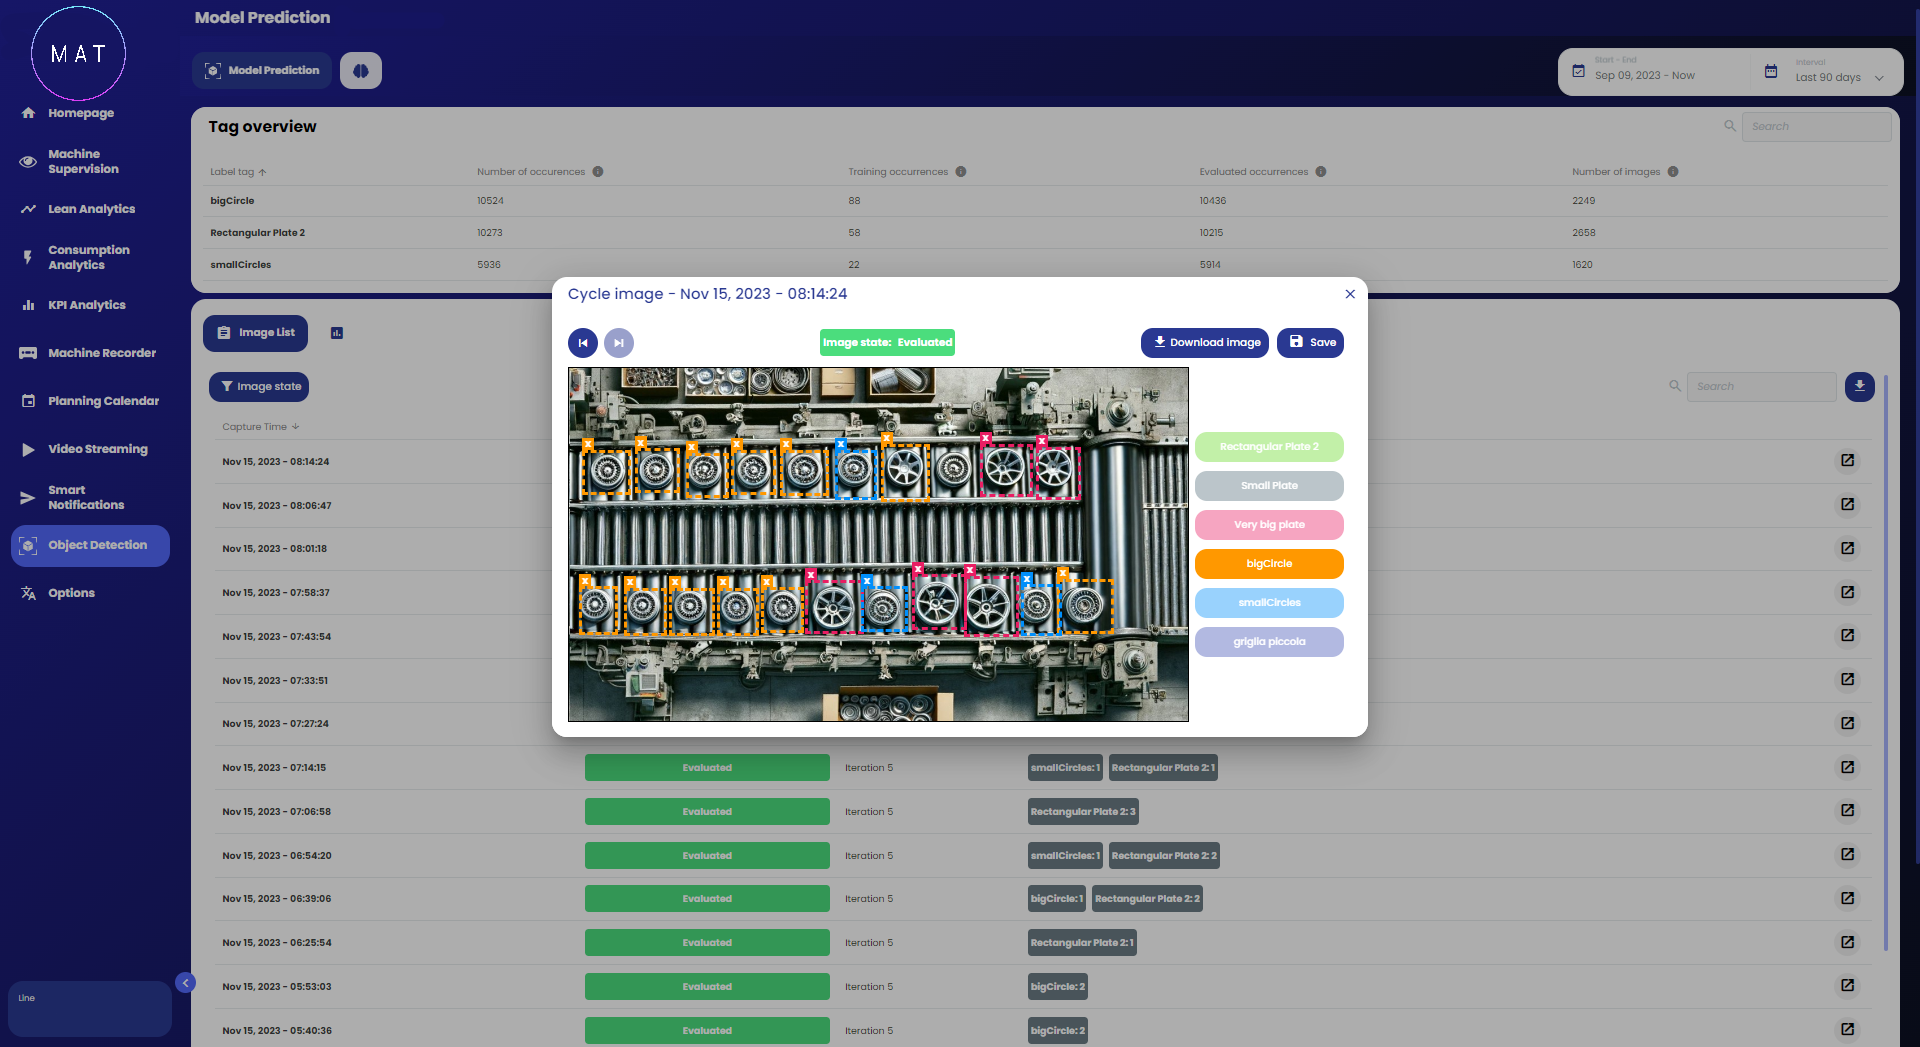
Since some "smallCircle" type objects on the right side of the line do not satisfy the user, in Image B you can see the correction made: the blue boxes have been removed and new fuchsia boxes have been drawn, which associate those objects with the "very big plate" tag.
By saving the work done, the image will be displayed on the main page reporting the Training Set status.